by
Caroline Zook


Chances are you’ve asked yourself this age-old question as a solopreneur creator: What product or service should I focus on??
We've been there! Whether you're currently juggling multiple revenue streams OR you're trying to decide which new digital product or service you want to offer, the exercise below will help.
Creating a Revenue Stream Comparison Chart
To determine what revenue stream to focus your attention on, it helps to list out all products and offers in one place so you can see them all.
Then, we're going to walk you through the process of identifying how much input (cost + time) and output (revenue) these ideas produce. Finally, you'll add in your own "X Factor" rating that can help you break any ties or pick a clear winning offer to focus on!

🔗 Click here to download this template as a PDF
Filling out the Revenue Stream Comparison Chart
Step 1: Write down your Revenue Streams
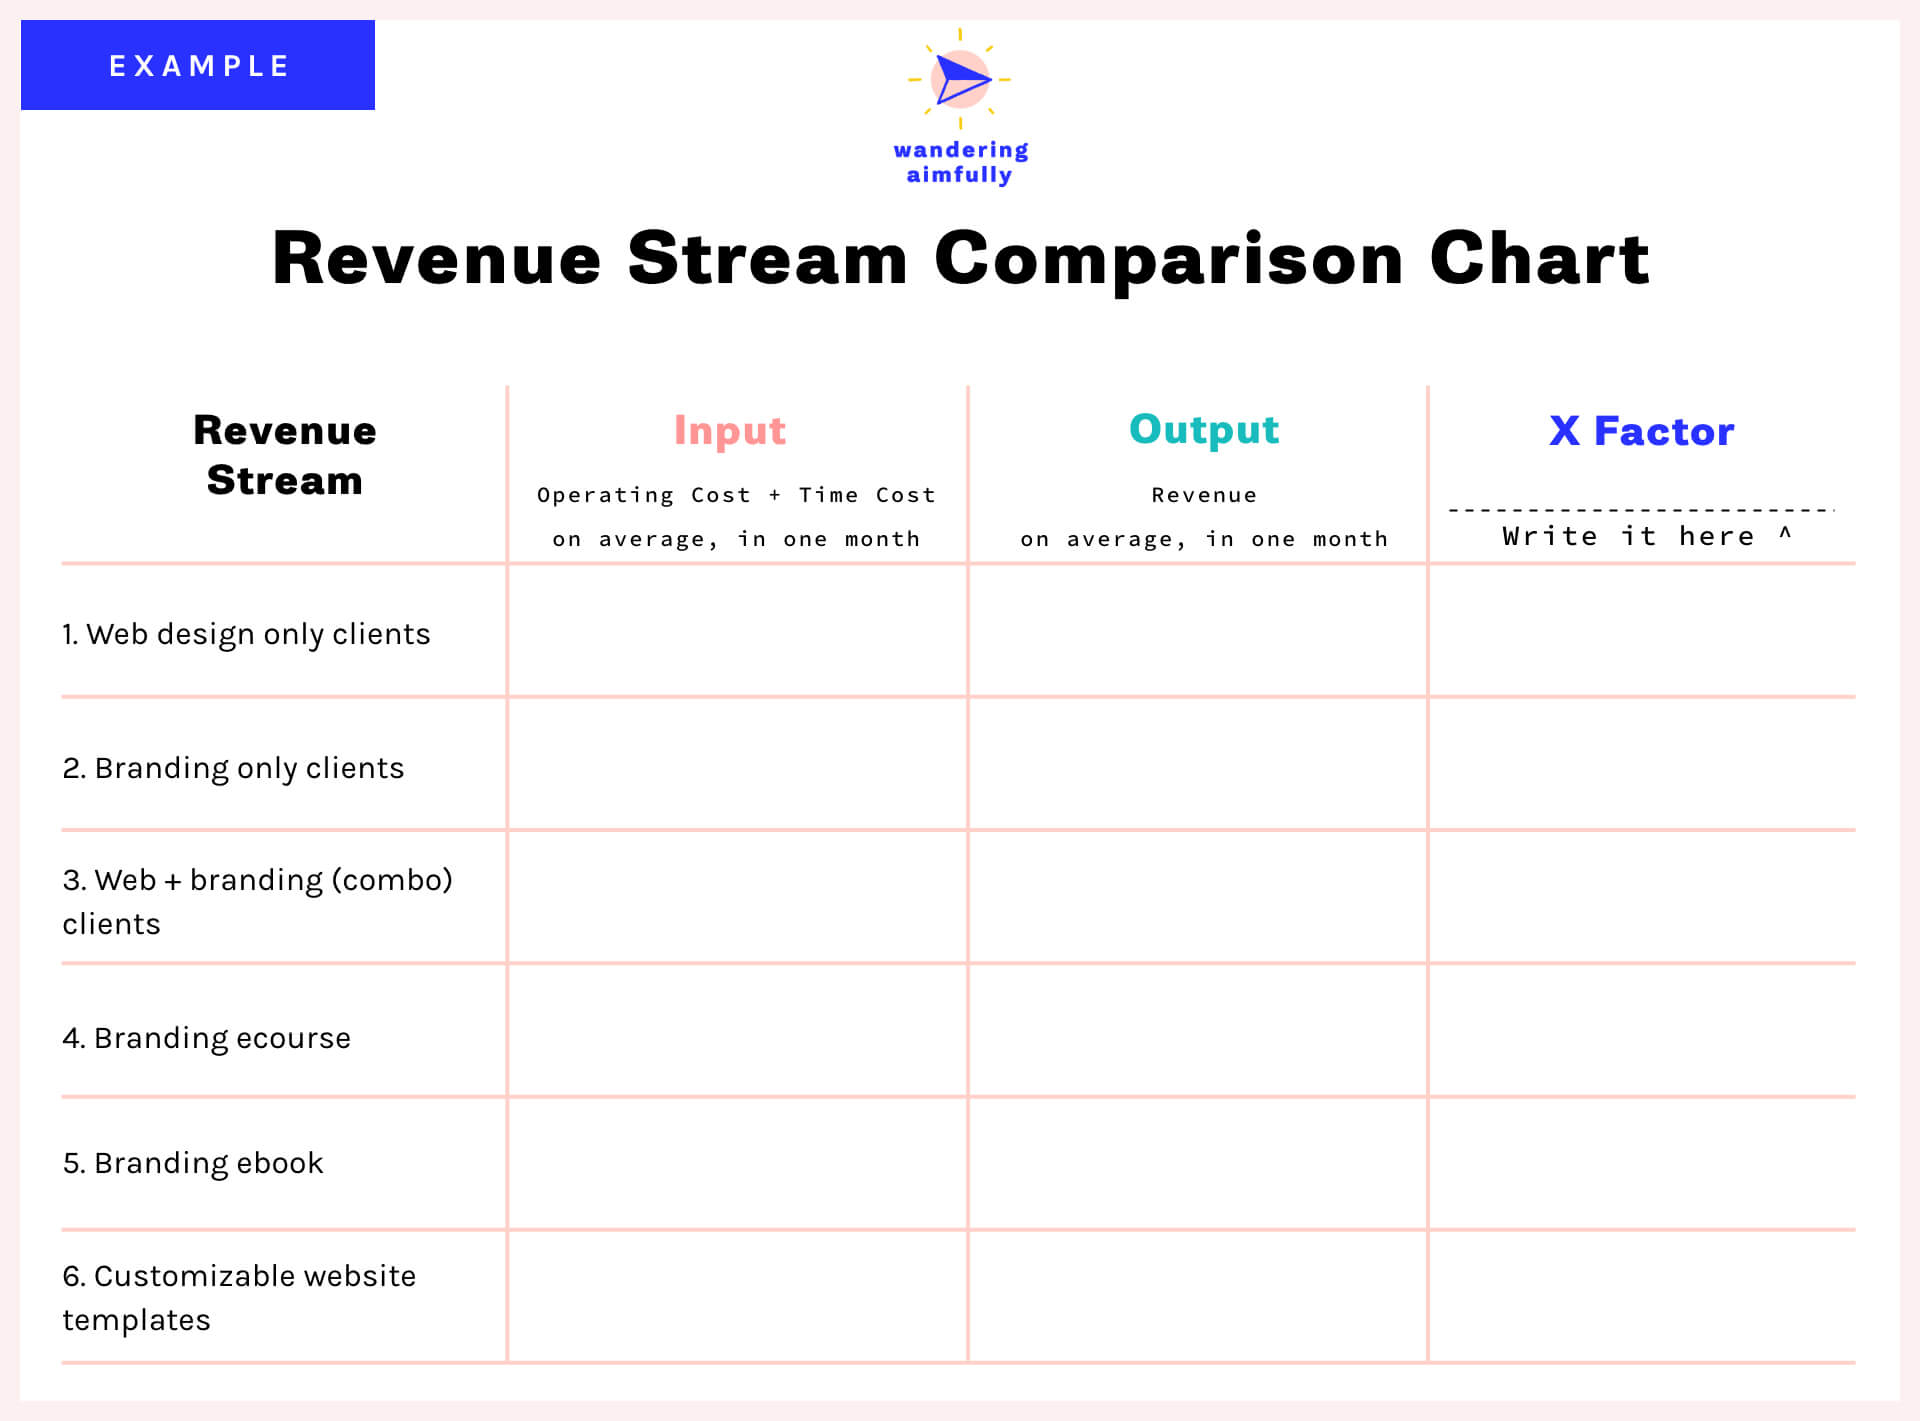
Download the PDF above or create your own table with 4 columns, listing out your various revenue streams as rows in the first column.
If you have one broad revenue stream such as client work (if you’re a designer, for example) we recommend breaking that down even further into categories. For example: web design clients, logo design clients, etc. This will allow you to make more specific conclusions about what to focus on.
If you have various product offerings, write each one out on a separate line.
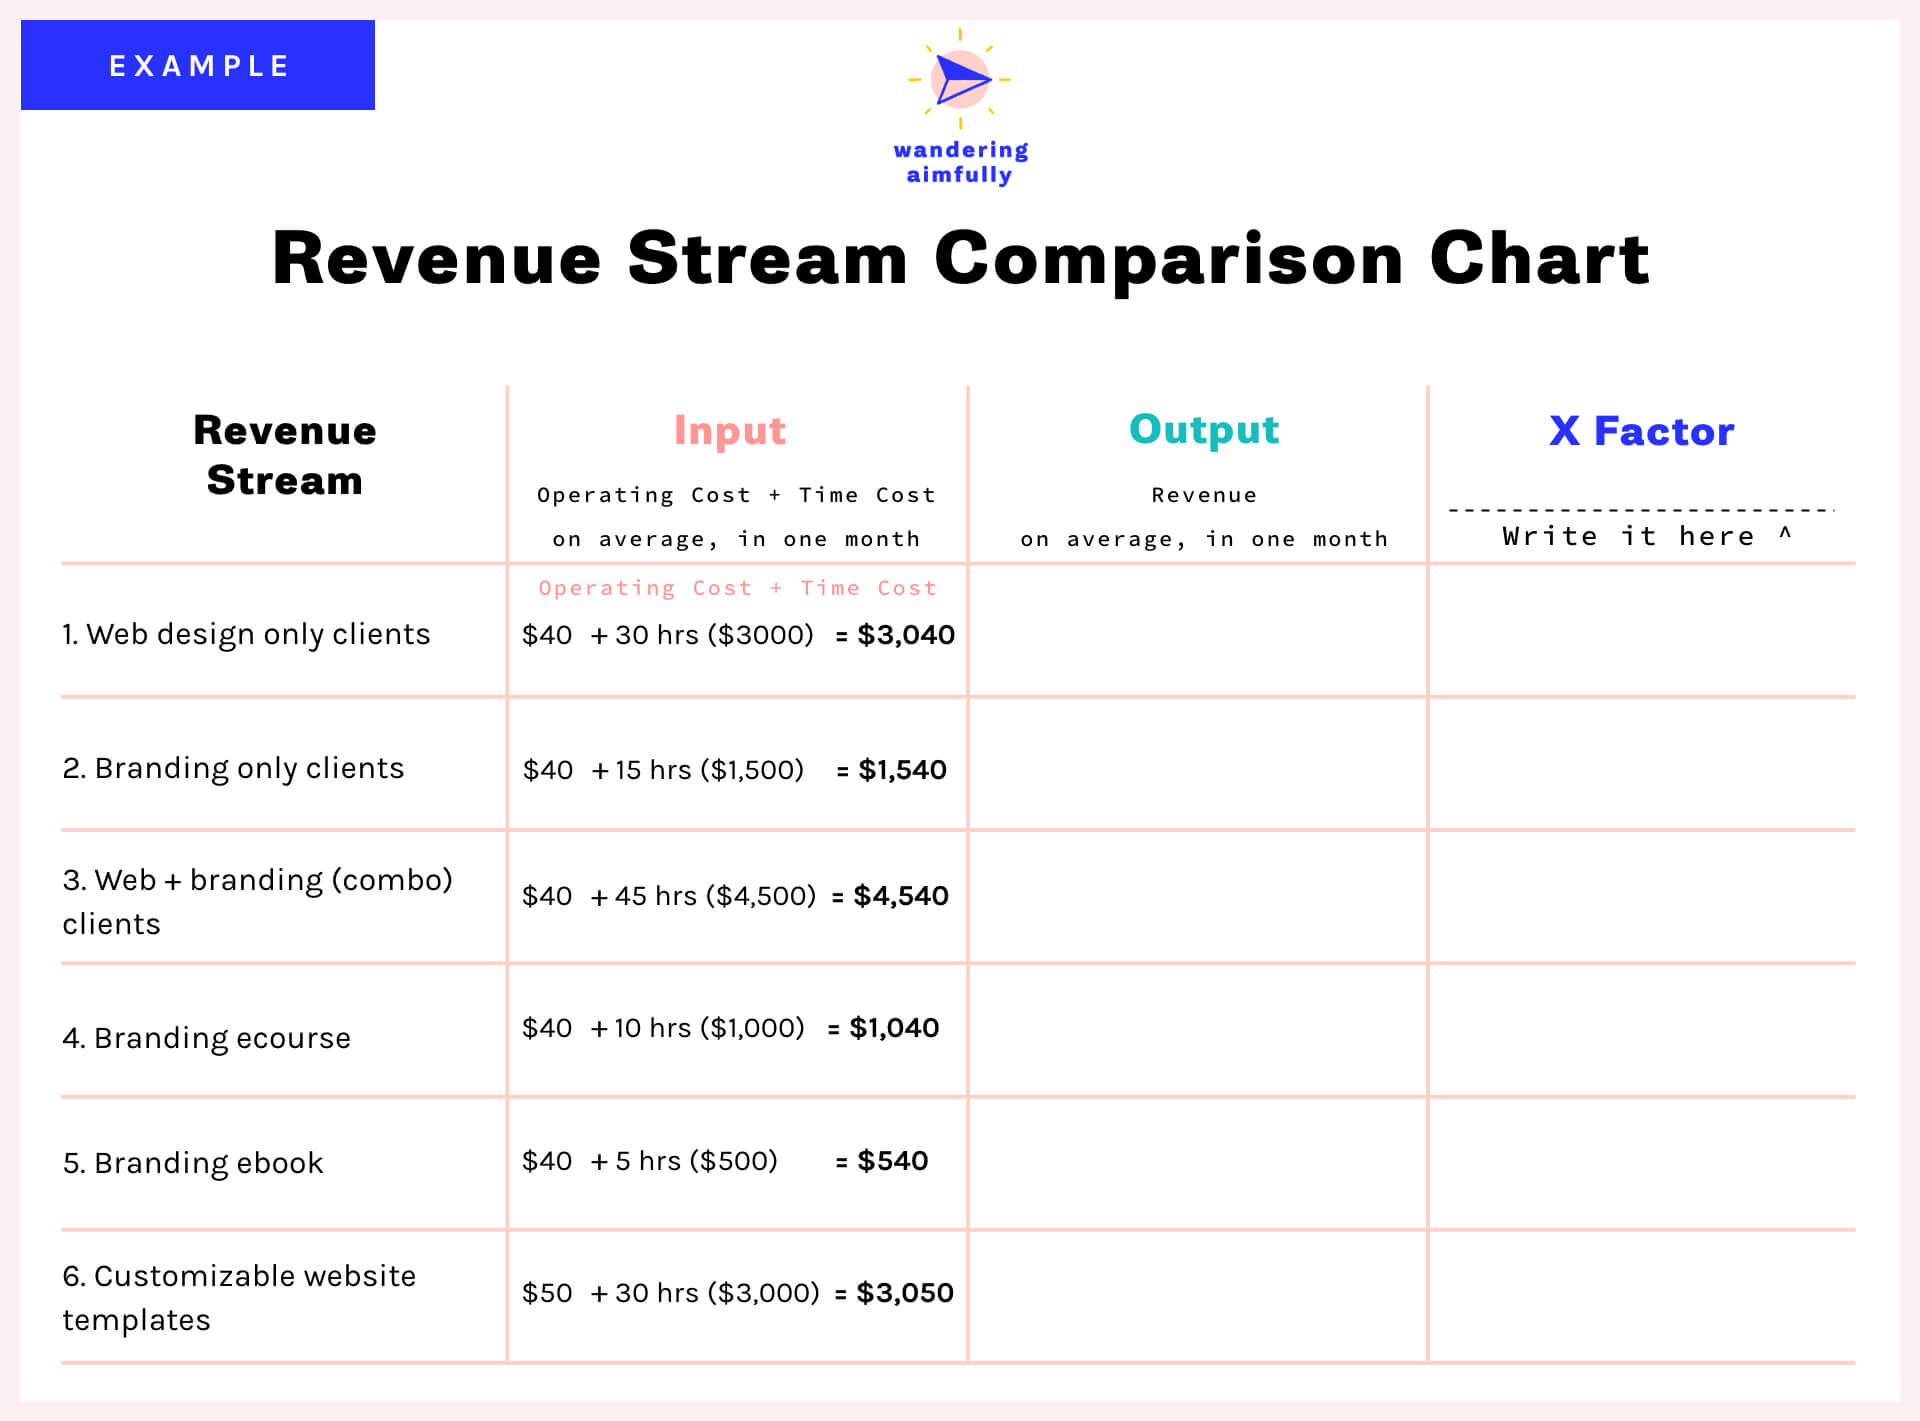
Step 2: Write down the "input" each revenue stream takes
For each revenue stream you’ve listed out, now write down the “input” in terms of money AND in terms of time it requires to operate that revenue stream.
Three things to note:
1. It helps to specify a timeframe for the input/output to make sure you’re comparing apples to apples. We recommend using one month. If that’s the case, you want to include how much operating cost you pour into that product or offering in a month’s time and how much time you contribute to it on a monthly basis. It may help to estimate your time by the week and then multiply by 4.
2. You may also want to assign a monetary value to your time in order to later compare it with that revenue stream’s output. For example, you could say your time is worth a flat $100/hour, so a revenue stream that takes 30 hours a month and $300 to run, would actually require $3,300 of input.
3. If you have general expenses that aren’t revenue stream specific, take that monthly total and divide it evenly among your various revenue streams so it’s a distributed cost.
4. As far as time goes, for products you want to think about ongoing input or operating input for the purposes of comparison, not necessarily the time it takes up front to create the product.
Step 3: Write down your revenue as "output"
If the revenue stream product or service already exists AND you're using a monthly number for the "input" column, you'll want to grab your historical data for the "output" column.
If the revenue stream does not yet exist, you can list a very conservative estimation.

Step 4: Define and rate your "X-Factor"
Now this last part is really crucial for the decision-making that will result from this comparison. Finally, use the fourth column as your “X factor”—aka one more comparison criteria that matters to you.
This X factor could be enjoyment (how much you like working on that revenue stream) or it could be alignment (how well it lines up with your personal values) or it could be something like “future vision” (how well it meshes with the vision of where you want to steer your brand.)
The point is, you get to choose. Write it down as the final column header and then write in a number between 1 and 10 for using that criteria for each one of your revenue streams.
That should complete your revenue comparison chart and it should look something like this:

Using the revenue stream comparison chart to make decisions
Now that you have all this information written down, it’s time to use it!
You want to use the comparison chart to look for the revenue stream with the greatest opportunity for impact. This means finding the revenue stream with the most efficient output to input ratio (ie. greatest output for the least input) but also with the highest X factor score.
Use an efficiency score to help you!
One way to do that is to divide the output column by the input column to come up with an “efficiency score.” This makes it super easy to see the stream with the greatest output for least input, because the score will be the highest number.

But, don’t forget, we have to also consider the X factor criteria. Your revenue stream with the highest efficiency score might actually be the one you enjoy the least, which isn’t necessarily the best thing to focus on going forward.
Instead, look for revenue streams with relatively high efficiency scores AND high X factor scores.
For example, you can see “Branding only clients” and “Branding ecourse” in the example have a similar efficiency score BUT one of them has a much higher enjoyment score:
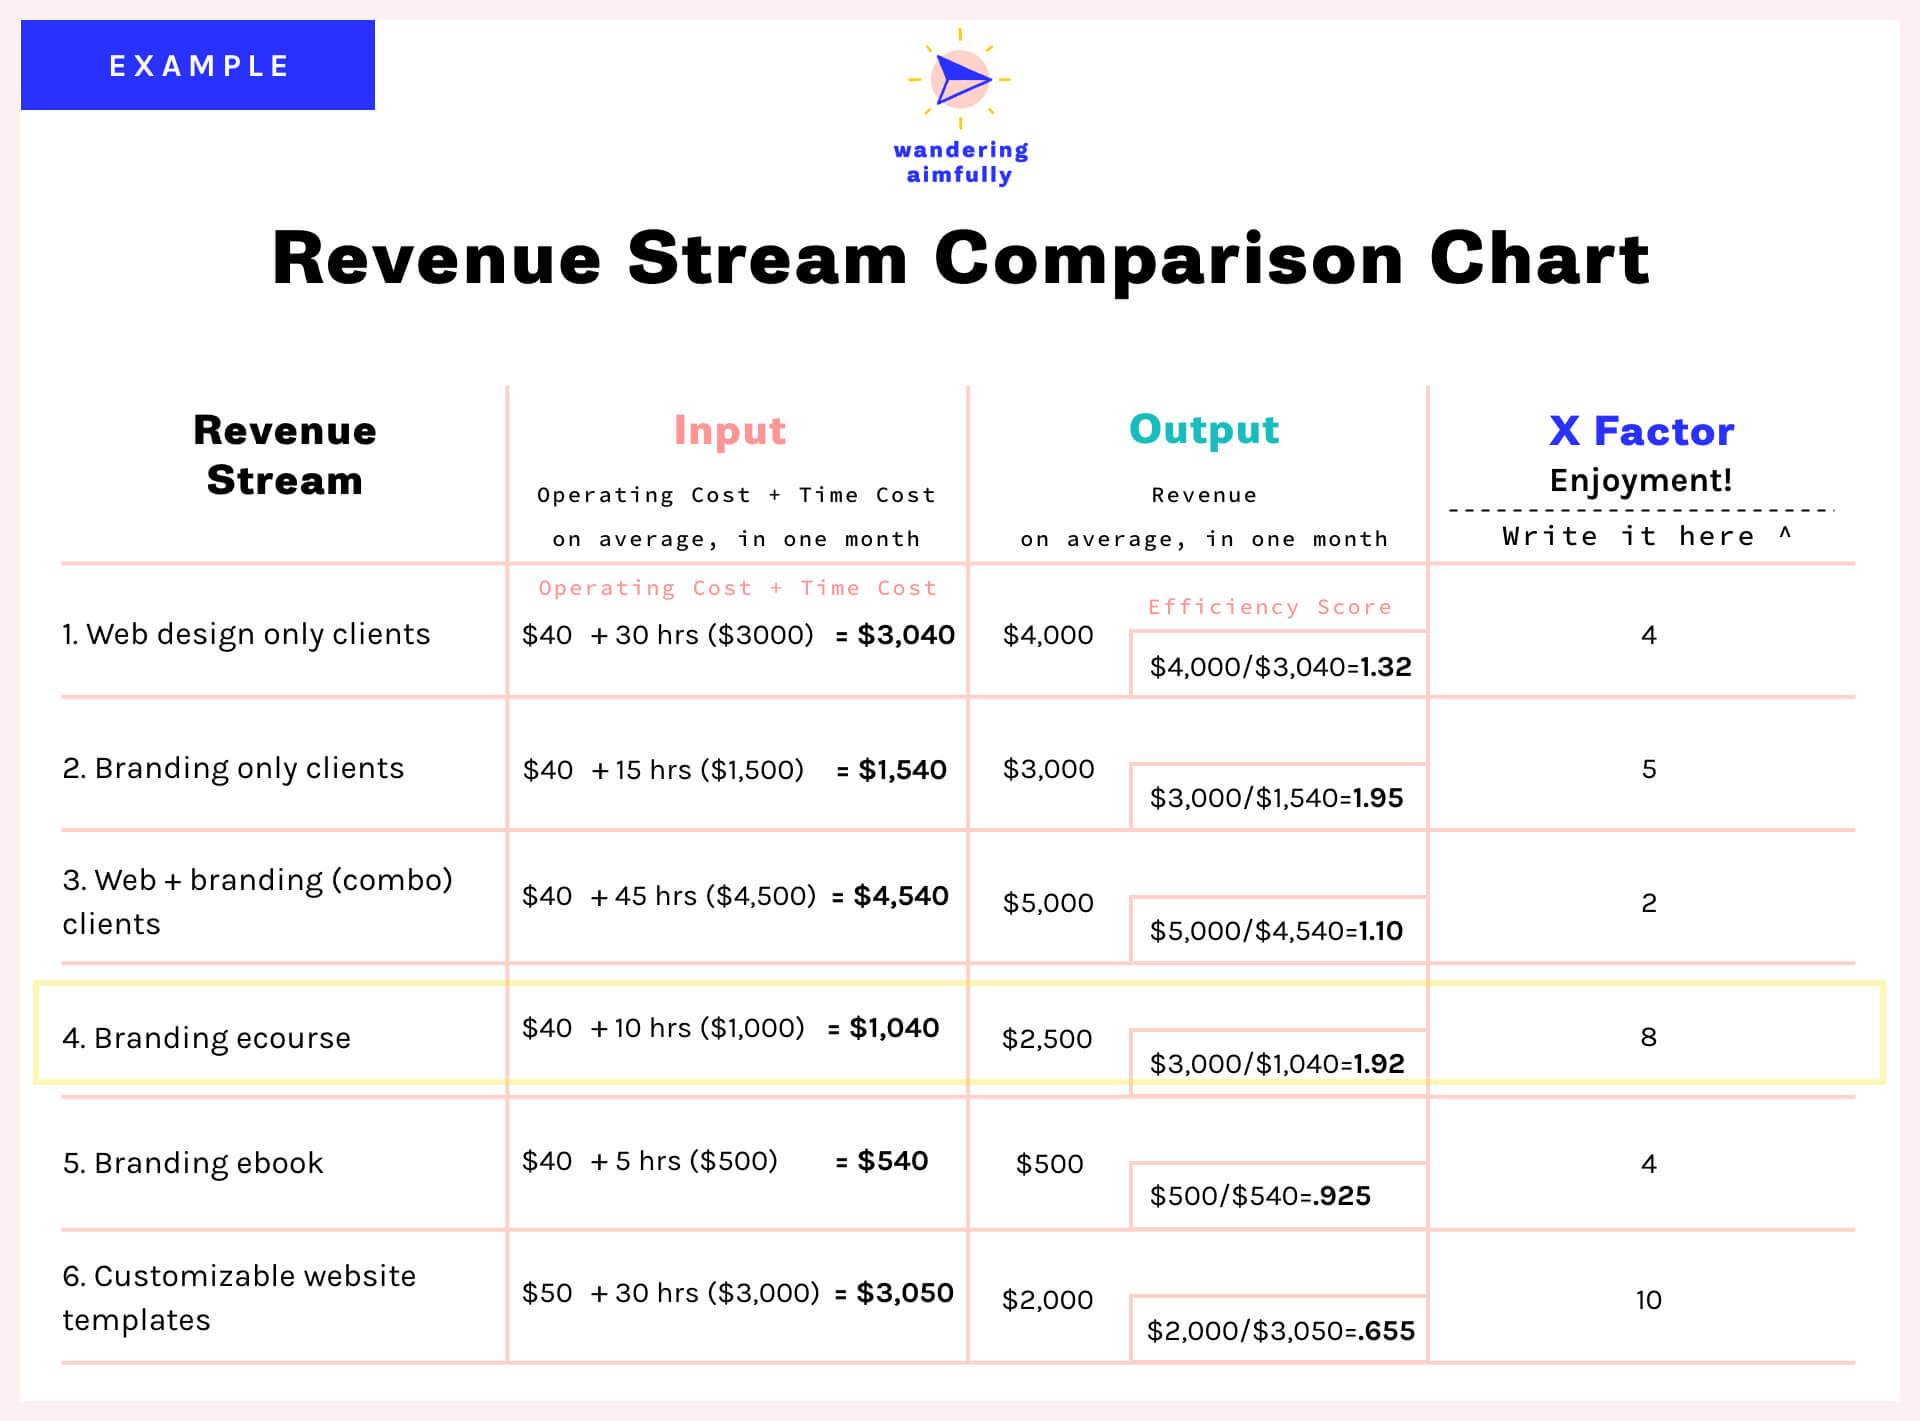
Using the example, now I’m able to see that out of all my various projects, the branding e-course is probably worth investing in and focusing on. While it may not be the source of greatest revenue (YET) it’s efficient at making money (meaning time poured into it will see a notable return) AND it’s something that I enjoy doing.
This is how you can use this comparison chart to choose what to focus on.
Keep in mind, you can make up your own rules too. Maybe instead of the efficiency score method, you want to choose the revenue stream that is making you the most money with the most enjoyment, and you don’t care how many hours or how much money it takes to operate. That’s okay. The idea is just to think critically about your various projects and make decisions based on real data, rather than simply feeling stuck or overwhelmed with no idea of what to focus on.
What about creating new revenue streams?
Now, you might be asking yourself, what if none of my current revenue streams are really working? Is it time to try creating something new?
The answer is maybe. We always try to caution people about immediately jumping to the conclusion that it’s time to create something new. Why? Because it’s all too easy to get caught up in “shiny object syndrome.” The nature of creativity is that we get excited about projects in the beginning and once time goes on they begin to lose their luster.
Part of running a successful and profitable business is learning how to use your time and energy in the most efficient, impactful way possible.
Creating something new often requires you to reinvent the wheel and while it may be exciting, it can be a drain on your resources. Instead, it’s advisable to find ways to fall back in love with your existing projects or find ways to breathe new life into those.

Join 12,000+ intentional business owners and get our Growing Steady newsletter every Monday where we share transparently about the latest projects we’re working on. You'll also get our Calm Creator Canva Whiteboard as a free download!